Recession, what recession?
Ever since I started up Majendi (Now Rittman Mead), the market for Siebel Analytics (now Oracle BI) has been a roller coaster. Looking back, supply and demand for consultants / contractors / permies has either been heavily biased to supply or to demand. Getting the balance right has been difficult for both sides.
Siebel Analytics never had a huge following, and hardly any outside of Siebel projects. Customers were reluctant to put significant investment into the product and therefore there were (relatively few opportunities for consultants to learn).
Then Oracle came along and changed all that.
Customers are now investing heavily in OBIEE, and all of it's features - not just Dashboards and Answers, but Delivers, BIP, and briefing books.
This Oracle takeover caused many new consultancies to switch from Disco, OWB and other Oracle products
In the meantime the great rush to send development offshore took place. Despite the difficulties companies pressed ahead with moving vital code building offshore because of the obvious cost savings. One client I was at tried to pretend that development went to India because they were the best in the world at developing OBIEE. It was nothing to do with the 300 dollars per day rate! (Their project failed btw).
Then the agencies moved in. I cannot tell you how many calls I get every day from someone saying they are specialist in the OBI marketplace. All I can say is that they think there is a pot of gold n the market, but soon disappear when they discover there isn't.
But whilst all this market activity was taking place there was a real economy. With real booms and busts. A friend of mine who has been in business for 10 years says this is the worst ever.
Well I can tell you that so far this has been our BEST year ever. Good ole OBI market does it again. Lots of implementations and few skilled, experienced consultants available.
Last year we saw a dip. That's when the real recession started, way before the banks started to feel the pinch. (In my view the recession was inevitable due to record oil prices).
I have two vacancies right now - you can start next week.
There are lots of jobs on Jobserve
but Contracts are keeping their heads down, so supply is tight
But companies have made an error of judgment, slashing rates by 10% across the board has upset a lot of contractors.
If you are an independent consultant with good OBIEE skills then do not believe what the agencies and companies are telling you - You are still worth the same as you were two years ago. Do not accept rates below GBP 500 per day minimum. If you have the skills and experience then do not be afraid to demand the proper rate.
And if you have just had your rate cut by 10% come to me and I'll show you where to earn properly again.
Showing posts with label OBIEE. Show all posts
Showing posts with label OBIEE. Show all posts
Wednesday, June 24, 2009
Wednesday, June 17, 2009
Dont Try This At Home Kids
Having just spent some time on a prjoect with Christian Berg and Venkat, and seeing some of the presentations at the BI Forum, I have come up with my all time top 10 of 'Don't do this without an Adult Supervisor'
1. Implement Essbase in OBIEE
2. Use xml editors to create reports
3. Have your repository created by UDML from a dynamic source
4. BPEL (Leave that to Tony H)
5. Use custom Javascript to manipulate the dashboards
6. Implement WebSSO
7. Use LDAP Groups
8. Use Dynamic Go URLs (Particularly when you have finished the development of the RPD)
9. Integrate multiple stars and Multiple dimensional attributes in a single Subject Area
10. Integrate BI Publisher
Relatively easy compared to the above is:
Settings up delivers, installing BI Apps in a Unix environment, creating multiple instances on a Linux blade, Briefing books, Configuring the DAC, customising BI Apps
But do your homework before going on the client site
Do you have any?
Thursday, May 21, 2009
Love Hate Essbase in OBIEE
Just you just love the speed of reporting on Essbase Cubes. Building the cubes is super fast. Having a simple report with one Measure is a pleasure to to build and run.
Now try doing anything that OBIEE is good at.
How about having a flat hierarchy? No Ok, what about Bins? No?
surely we can put a filter in place? Ah, Of course you can - providing the filter value exists, otherwise your report throws up an error.
Error, no data is an error!!
Ok lets have some nice looking data.
what do you mean every 'member' has to unique? And what a member when it's at home?
I want the value shown to be 'London' not 'London (location)'
I hate errors. I hate rubbish looking data. I hate ragged hierarchies. Give me back my Materialised views.
Christian, Venkat, Tony, Oracle - let's have some decent blogs on this for beginners like me.
BTW We are being good boys and using ASO as recommneded by Edward at the BI Forum ;)
Thursday, May 07, 2009
A sneak preview of 11g?
I think I have found my favorite client.
Not only are we analysing 4GB of data, 4 times every day, in a 10 minute ETL, but we're adding some cool features to the dashboards.
One feature is tree view. Those who use APEX will be familiar with how these work, and I suspect it's the same javascript code in the background.
I am using the tree viewing in two ways, one to navigate through data, organised in hierarchies, and the other as a reports/dashboard navigator. Using a look up table which contains the 'menu' items. This is useful where there are lots and lots of reports and dashboards and you want to give everyone a similar front end menu.
Whilst we were having fun with trees we then added some tabs inside a dashboard page - in fact we even have tabs inside tabs inside pages. The tricky bit is getting content into the tabs, which involves some xml fun and games - not recommended!.
One last bit of gadgetry we put in last night was a simple show/hide routine that is used to display whole reports, or just hide tables or charts on a report. This enables us to load lots of reports on a page then flick between them very quickly - no waiting for a page to load. You have more control of prompts here too.
Friday, February 20, 2009
More Big Tips Please
Reply from Phil as follows:
Of course Adrian, I've got loads.
How about this one:
When you do a combined request you can't change the column headings in the Edit Column Formula window as any changes you make there aren't saved. However, you can change the column name in the Column Properties \ Column Format window just fine.
(I have better tips than this but I'm just warming up).
Surely someone out there can challenge Phil to tip showdown?
Wednesday, December 10, 2008
Stars and Snowflakes
Part 2
Continuing on the discussion about OBIEE (Oracle BI EE) structure of the Logical Layer - please read Part 1 before this chapter.
To set the context, The discussion is around your choices in table design in the warehouse and I am only referring to the reporting in OBIEE on the datawarehouse, and your design considerations for Logical Tables, logical Table Sources and Physical Joins in the Physical Layer. Another point to note is that I am not too concerned about the theoretical difference between Snowflakes and Normalised, in the example shown in Part 1 you could call that a Snowflake or a Normalised design. Some have described Snowflakes as semi-normalised stars which is a fair decription, but the important point for the discussion is that there is at least one join between dimensions, which instantly makes it a non-star design, and is on the road to normalisation.
In part three I will look at a mixed model - Logical stars with normalised physical tables.
I do believe the actual dataWarehouse design and ETL routines should follow what you decide in your logical design considerations. Having said that though, I don't think that the whole reporting system can be developed in a linear path, you often have to loop back at each stage when more clarity is found.
And finally, Please join in the discussion by posting your comments.
Now, on with the blog...
From Part 1 some of you may be thinking that I'm advocating that Stars are not always required in the warehouse. Well, I tried to put together a fair case for the use of normalised design as best as I could. Now, lets have a look at the case for a pure star.
Continuing with the Contact example used in part 1, we can redraw the model in a logical and physical pure star.
Part 2A
I'll explore these in part 3.
Continuing on the discussion about OBIEE (Oracle BI EE) structure of the Logical Layer - please read Part 1 before this chapter.
To set the context, The discussion is around your choices in table design in the warehouse and I am only referring to the reporting in OBIEE on the datawarehouse, and your design considerations for Logical Tables, logical Table Sources and Physical Joins in the Physical Layer. Another point to note is that I am not too concerned about the theoretical difference between Snowflakes and Normalised, in the example shown in Part 1 you could call that a Snowflake or a Normalised design. Some have described Snowflakes as semi-normalised stars which is a fair decription, but the important point for the discussion is that there is at least one join between dimensions, which instantly makes it a non-star design, and is on the road to normalisation.
In part three I will look at a mixed model - Logical stars with normalised physical tables.
I do believe the actual dataWarehouse design and ETL routines should follow what you decide in your logical design considerations. Having said that though, I don't think that the whole reporting system can be developed in a linear path, you often have to loop back at each stage when more clarity is found.
And finally, Please join in the discussion by posting your comments.
Now, on with the blog...
From Part 1 some of you may be thinking that I'm advocating that Stars are not always required in the warehouse. Well, I tried to put together a fair case for the use of normalised design as best as I could. Now, lets have a look at the case for a pure star.
Continuing with the Contact example used in part 1, we can redraw the model in a logical and physical pure star.

Running the same report.

And obviously it works, but look at the SQL:
SELECT
T3489."ATTRIB_11" as c1,
sum(T3517."BLAH_VALUE") as c2
from "W_PERSON_DX" T3489,
"W_PERSON_F" T3517
where ( T3489."ROW_WID" = T3517."CONTACT_WID" )
group by T3489."ATTRIB_11"order by 1
So this time the join is direct in the physical layer, and therefore the server does not add in another table to get the answer.
Is this reduction in joins THE main reason why you design a pure star? Or are there other reasons why star = good?
So on the face of it there is no problem with either method. The star method was very efficient in the query, minimising the number of joins. But at what cost to the ETL process? Here, in this example, none because it joined to an existing key, however if you were talking about say, Account Id, then the mapping would have to look it up and add it to the target table. Of course the Star Transformation in the db will struggle with the normalised schema (or will it – answers on a postcard).
But. I cheated. Twice. Firstly, this is a very simple model, with little data in, so design is not vital.
Secondly, what if I want to do this …..
Part 2A
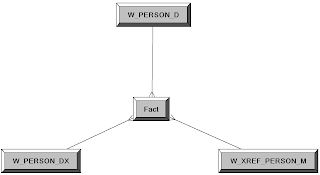
Let's build a hybrid. Surely we can use a star and introduce some level of normalisation and all will be well? Consider the following design.

The above 'star' has all the physical dimension tables in the single dimension logical table.
We have a logical star. With Physical table sources arranged in a physical star, except we have a few ‘spokes’ around some of the physical dimension tables (this is essentially what mosst people would call a Snowflake!). A common use here would be a ‘List of Values’.
Does it work? and is it 'better'?There are two considerations
- Errors is Analytics generating SQL
- Duplication of data.
I'll explore these in part 3.
Subscribe to:
Posts (Atom)
The Cowes

Cowes Racing

